


Log Analytics in Azure
Introduction
Learn about Log Analytics in this article by Ritesh Modi, an ex-Microsoft Senior Technology Evangelist. He is a Microsoft Regional Director and the Regional Lead for Microsoft certified trainers.
Log Analytics service helps in providing information about environments using its rich log storage and analytic features. Application Insights is used for monitoring applications. However, it is equally important to monitor the environment on which an application is hosted and running. This involves the infrastructure, such as virtual machines, Docker containers, and related components.
Provisioning Log Analytics, also known as the Operational Management Suite (OMS), must be provisioned on Azure before it can be used to monitor virtual machines and containers. Again, similar to Application Insights, Operational Insights can be provisioned through the Azure Portal, PowerShell, REST APIs, and resource group manager templates. An Operational Insights workspace is a security boundary that can be accessed by certain users. Multiple workspaces should be created to isolate users and their corresponding access to environment telemetry data.
The JSON script used to provision an Operational Insights workspace is shown here:
The name, location, and sku information is needed to provision a workspace, and their values are provided using parameters.
The workspace after provisioning is shown in the following screenshot:
Click on the OMS portal section to open the workspace portal. This portal is used to view all telemetry information captured by Operational Insights, configure Operational Insights, and provide dashboard features and functionality.
The home screen of Operational Insights is shown here:
The Settings section shows that four data sources are connected. These are four virtual machines connected to the OMS workspace from the test and production environments. A different strategy of having a separate workspace for each environment can be adopted, and it is left to readers to decide what's best for their applications and solutions. Operational Insights can be configured using the Settings tile:
OMS agents
You may have noticed that no assembly or code changes are made to the application to consume Operational Insights. Operational Insights depends on the installation of an agent on virtual machines. These agents keep collecting telemetry data from these hosts and send them to the Operational Insights workspace, where they are stored for a specified period of time depending upon the sku chosen. These agents can be installed manually on virtual machines. ARM virtual machine extensions install agents automatically, immediately after provisioning the virtual machines. The JSON code for provisioning of an agent on a virtual machine is shown here:
The workspaceId and accountid are available from the Settings tile of the OMS workspace, and the copy element is used to deploy it to multiple virtual machines. This resource is a child resource of the virtual machine resource, ensuring that this extension is executed whenever a virtual machine is provisioned or updated.
The configuration related to workspace ID and account ID is shown next. The primary key is used as an account ID for configuring the agents using ARM templates.
Search
The OMS workspace provides search capabilities to search for specific log entries, export all telemetry data to Excel and/or PowerBI, and search language specific to OMS.
The Log Search screen is shown here:
Solutions
Solutions in OMS are additional capabilities that can be added to the workspace, capturing additional telemetry data that is not captured by default. When these solutions are added to the workspace, appropriate management packs are sent to all the agents connected to the workspace in the context of configuring themselves for capturing solution-specific data from virtual machines and containers, and then start sending it to the OMS workspace.
The following screenshot shows the solution gallery and capacity and performance solution on the OMS workspace. Clicking on any solution and subsequently clicking on the Add button adds the solution to the workspace, as shown below:
Azure provides lots of OMS solutions for tracking and monitoring different aspects of environments and applications. At a minimum, a set of solutions that are generic and applicable to almost any environment should be added to the workspace:
Alerts
Log Analytics allows us to generate alerts on the ingested data. It does so by running a pre-defined query composed of conditions on the incoming data. If it finds any records that fall within the ambit of the query, it generates an alert. Log Analytics provides a highly configurable environment for determining the conditions for generating alerts, time windows in which the query should return the records, time windows in which the query should be executed, and actions to be taken when the query returns results as alerts.
The first step in configuring an alert is to create a saved search. A saved search is simply a search query against Log Analytics, as shown below:
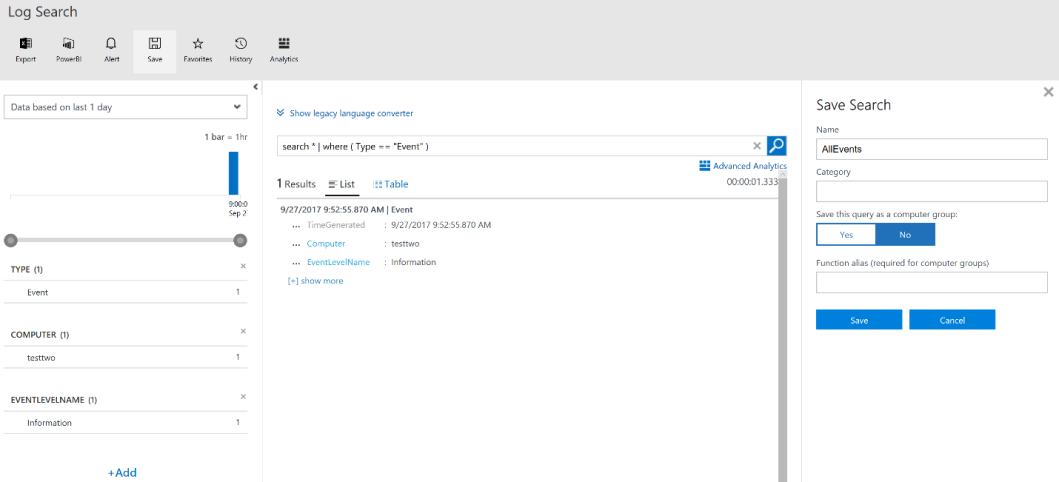
Save the query by providing a name for it. After saving the query, click on the Alert button from the Log Search menu. It provides the user an interface for defining and adding a new alert rule:
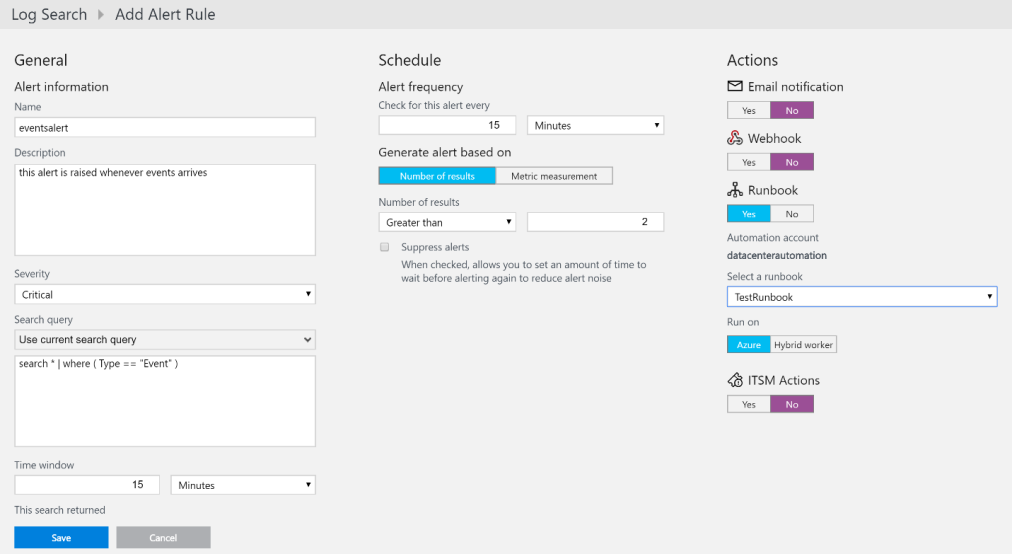
Within this single screen, all configurations related to an alert rule can be performed. You need to provide a name, description, severity, and the query to be executed as part of the rule evaluation within their respective fields.
The time window specifies the data interval in which the query should be executed. In the screenshot, whenever the rule is executed, it processes data from the last 15 minutes.
The schedule section helps you configure the frequency of rule execution. It answers the question, how frequently should the query run? In the previous screenshot, the rule is executed every 15 minutes. The time window should be more than the alert frequency. The alerts can be further configured based on the number of results found. It need not be that an alert is generated for every instance of data found based on the query. It can further be quantified to accumulate a certain quantity of results before raising the requests. The alerts can also be generated based on metric measurements. Additional configuration to suppress alerts can be done. You can create a time interval that should elapse before the action is executed. In this case, alerts are generated but the action is executed only after the configured interval has elapsed.
The Actionssection allows us to configure things that should follow an alert. Generally, there should be a remedial and/or notification action. Log Analytics provides four different ways to create a new action. They can be combined in any way. An alert will execute any and all the following configured actions:
If you found this article interesting, you can explore Azure for Architects to create advanced data and integrated solutions using Azure Event Grid, functions, and containers. Azure for Architects can help you develop a full-fledged Azure cloud solution that is Enterprise class and future-ready.
Learn about Log Analytics in this article by Ritesh Modi, an ex-Microsoft Senior Technology Evangelist. He is a Microsoft Regional Director and the Regional Lead for Microsoft certified trainers.
Log Analytics service helps in providing information about environments using its rich log storage and analytic features. Application Insights is used for monitoring applications. However, it is equally important to monitor the environment on which an application is hosted and running. This involves the infrastructure, such as virtual machines, Docker containers, and related components.
Provisioning Log Analytics, also known as the Operational Management Suite (OMS), must be provisioned on Azure before it can be used to monitor virtual machines and containers. Again, similar to Application Insights, Operational Insights can be provisioned through the Azure Portal, PowerShell, REST APIs, and resource group manager templates. An Operational Insights workspace is a security boundary that can be accessed by certain users. Multiple workspaces should be created to isolate users and their corresponding access to environment telemetry data.
The JSON script used to provision an Operational Insights workspace is shown here:
    {
      "apiVersion": "2015-11-01-preview",
      "type": "Microsoft.OperationalInsights/workspaces",
      "name": "[parameters('workspaceName')]",
      "location": "[parameters('deployLocation')]",
      "properties": {
        "sku": {
          "Name": "[parameters('serviceTier')]"
        }
      }
    }
The name, location, and sku information is needed to provision a workspace, and their values are provided using parameters.
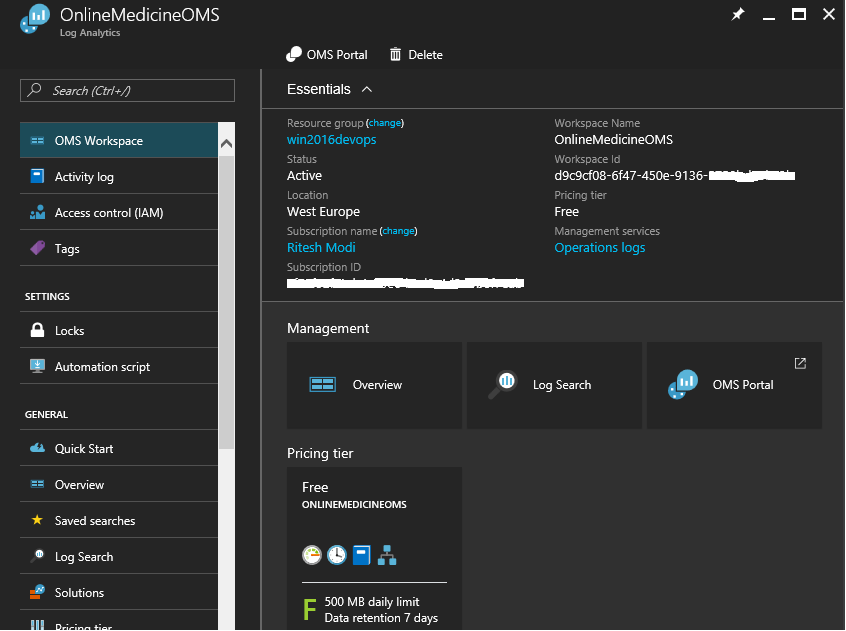
The workspace after provisioning is shown in the following screenshot:
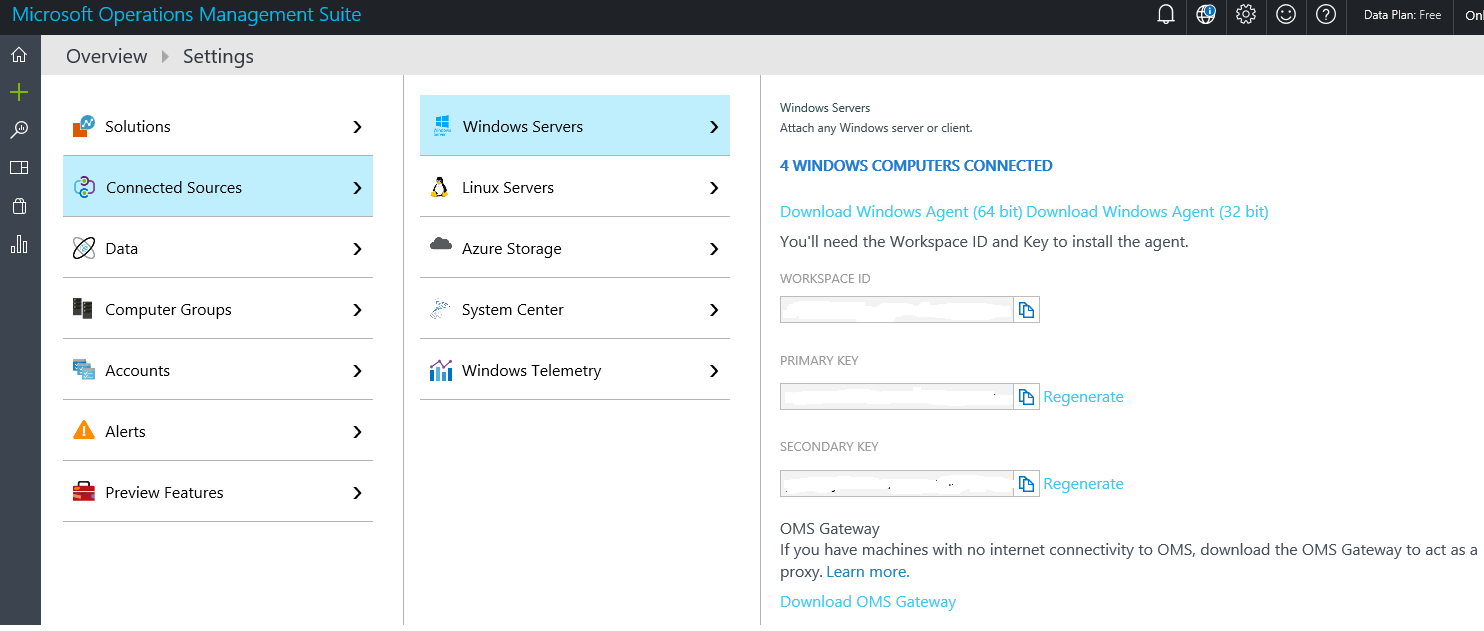
Click on the OMS portal section to open the workspace portal. This portal is used to view all telemetry information captured by Operational Insights, configure Operational Insights, and provide dashboard features and functionality.
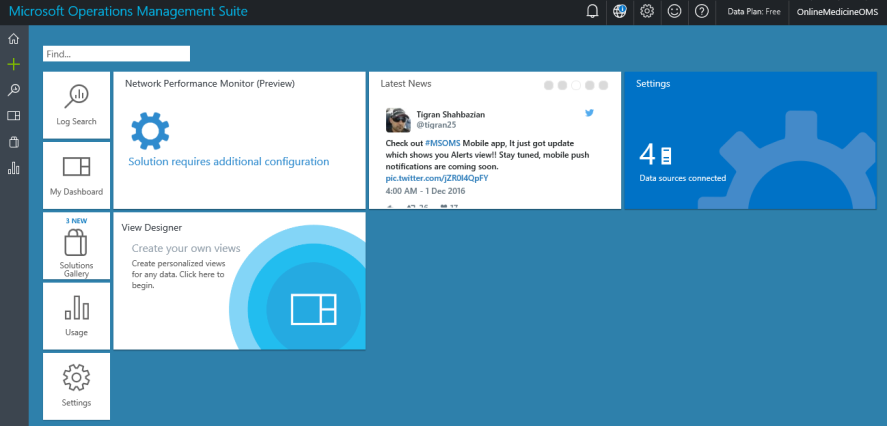
The home screen of Operational Insights is shown here:
The Settings section shows that four data sources are connected. These are four virtual machines connected to the OMS workspace from the test and production environments. A different strategy of having a separate workspace for each environment can be adopted, and it is left to readers to decide what's best for their applications and solutions. Operational Insights can be configured using the Settings tile:
OMS agents
You may have noticed that no assembly or code changes are made to the application to consume Operational Insights. Operational Insights depends on the installation of an agent on virtual machines. These agents keep collecting telemetry data from these hosts and send them to the Operational Insights workspace, where they are stored for a specified period of time depending upon the sku chosen. These agents can be installed manually on virtual machines. ARM virtual machine extensions install agents automatically, immediately after provisioning the virtual machines. The JSON code for provisioning of an agent on a virtual machine is shown here:
    {
      "apiVersion": "2015-06-15",
      "type": "Microsoft.Compute/virtualMachines/extensions",
      "name": "[concat(variables('vmName'),copyIndex(1),'/omsscript')]",
      "location": "[resourceGroup().location]",
      "dependsOn": [
        "[concat('Microsoft.Compute/virtualMachines/',variables('vmName'),copyIndex(1))]",
        "[resourceId('Microsoft.Compute/virtualMachines/extensions', concat(variables('vmName'),copyIndex(1)),'powershellscript')]"
      ],
      "copy": {
        "count": "[parameters('countVMs')]",
        "name": "omsloop"
      },
      "properties": {
        "publisher": "Microsoft.EnterpriseCloud.Monitoring",
        "type": "MicrosoftMonitoringAgent",
        "typeHandlerVersion": "1.0",
        "settings": {
          "workspaceId": "[parameters('WorkspaceID')]"
        },
        "protectedSettings": {
          "workspaceKey": "[listKeys(variables('accountid'),'2015-11-01-preview').primarySharedKey]"
        }
      }
    }
The workspaceId and accountid are available from the Settings tile of the OMS workspace, and the copy element is used to deploy it to multiple virtual machines. This resource is a child resource of the virtual machine resource, ensuring that this extension is executed whenever a virtual machine is provisioned or updated.
The configuration related to workspace ID and account ID is shown next. The primary key is used as an account ID for configuring the agents using ARM templates.
Search
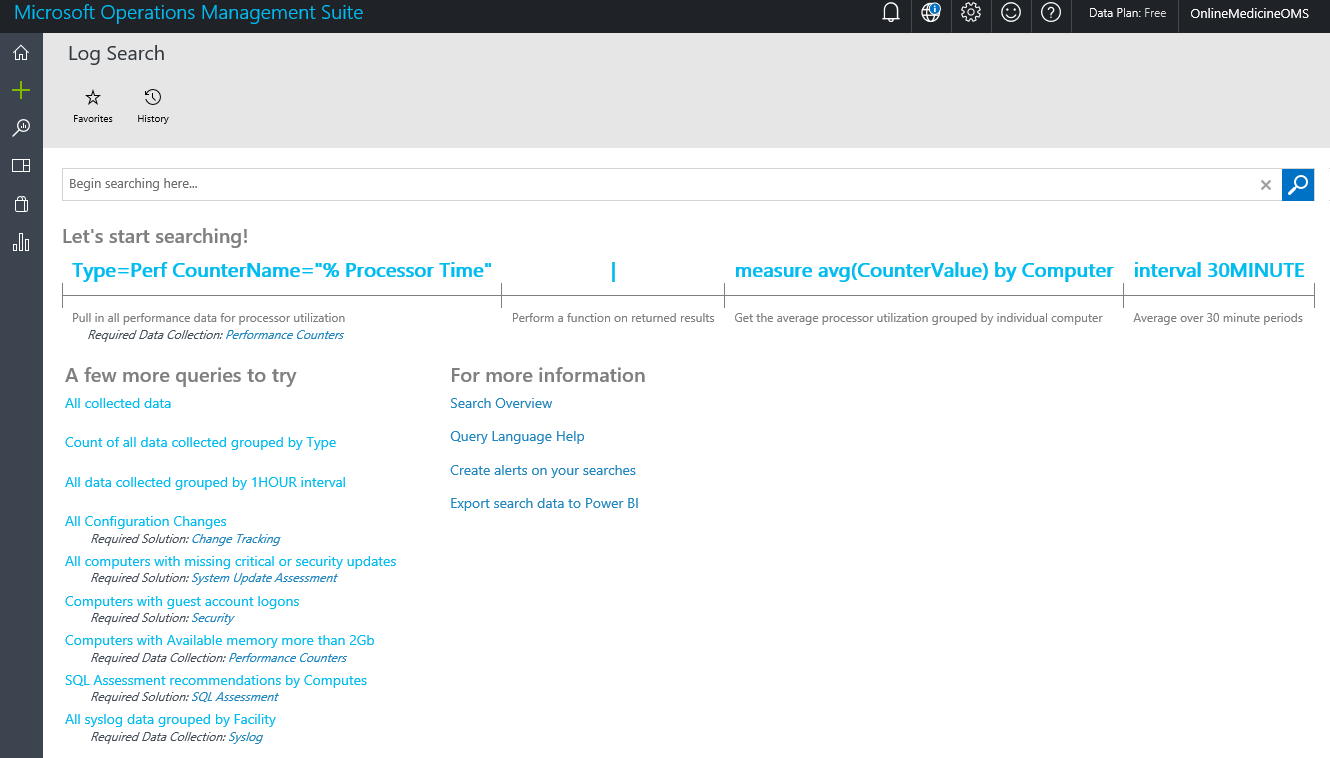
The OMS workspace provides search capabilities to search for specific log entries, export all telemetry data to Excel and/or PowerBI, and search language specific to OMS.
The Log Search screen is shown here:
Solutions
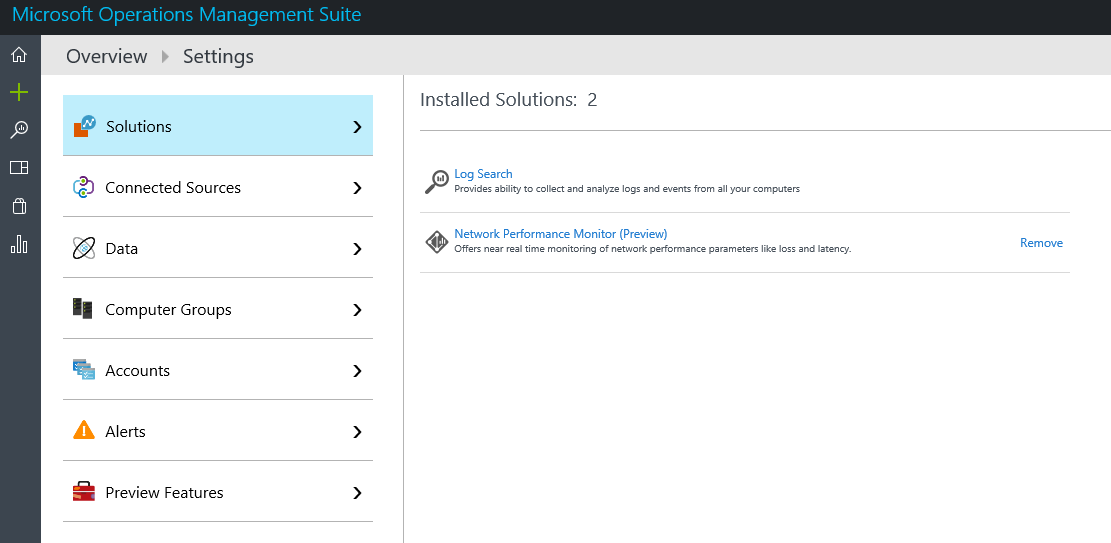
Solutions in OMS are additional capabilities that can be added to the workspace, capturing additional telemetry data that is not captured by default. When these solutions are added to the workspace, appropriate management packs are sent to all the agents connected to the workspace in the context of configuring themselves for capturing solution-specific data from virtual machines and containers, and then start sending it to the OMS workspace.
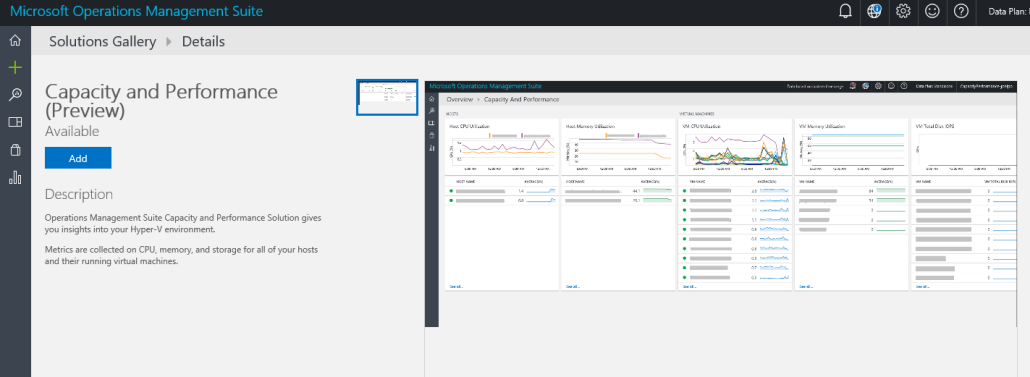
The following screenshot shows the solution gallery and capacity and performance solution on the OMS workspace. Clicking on any solution and subsequently clicking on the Add button adds the solution to the workspace, as shown below:
Azure provides lots of OMS solutions for tracking and monitoring different aspects of environments and applications. At a minimum, a set of solutions that are generic and applicable to almost any environment should be added to the workspace:
- Capacity and performance
- Agent health
- Change tracking
- Containers
- Security and audit
- Update management
- Network performance monitoring
Alerts
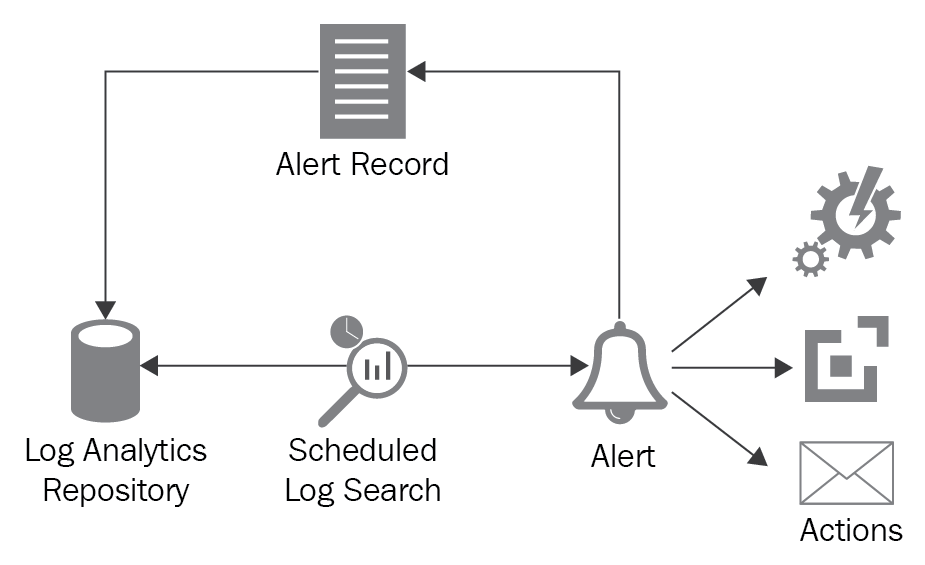
Log Analytics allows us to generate alerts on the ingested data. It does so by running a pre-defined query composed of conditions on the incoming data. If it finds any records that fall within the ambit of the query, it generates an alert. Log Analytics provides a highly configurable environment for determining the conditions for generating alerts, time windows in which the query should return the records, time windows in which the query should be executed, and actions to be taken when the query returns results as alerts.
The first step in configuring an alert is to create a saved search. A saved search is simply a search query against Log Analytics, as shown below:
Save the query by providing a name for it. After saving the query, click on the Alert button from the Log Search menu. It provides the user an interface for defining and adding a new alert rule:
Within this single screen, all configurations related to an alert rule can be performed. You need to provide a name, description, severity, and the query to be executed as part of the rule evaluation within their respective fields.
The time window specifies the data interval in which the query should be executed. In the screenshot, whenever the rule is executed, it processes data from the last 15 minutes.
The schedule section helps you configure the frequency of rule execution. It answers the question, how frequently should the query run? In the previous screenshot, the rule is executed every 15 minutes. The time window should be more than the alert frequency. The alerts can be further configured based on the number of results found. It need not be that an alert is generated for every instance of data found based on the query. It can further be quantified to accumulate a certain quantity of results before raising the requests. The alerts can also be generated based on metric measurements. Additional configuration to suppress alerts can be done. You can create a time interval that should elapse before the action is executed. In this case, alerts are generated but the action is executed only after the configured interval has elapsed.
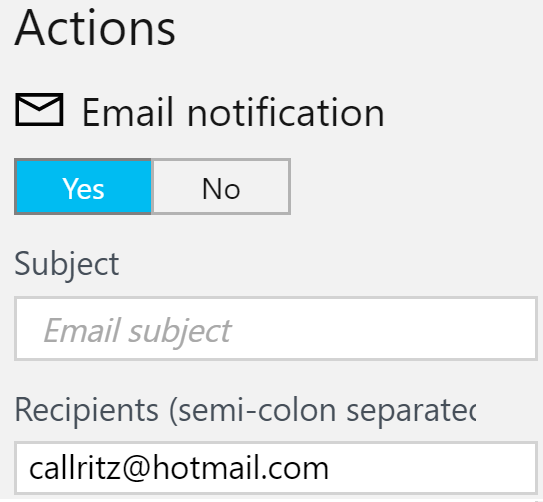
The Actionssection allows us to configure things that should follow an alert. Generally, there should be a remedial and/or notification action. Log Analytics provides four different ways to create a new action. They can be combined in any way. An alert will execute any and all the following configured actions:
- Email notification: This is the simplest, and sends an email to the configured recipients:
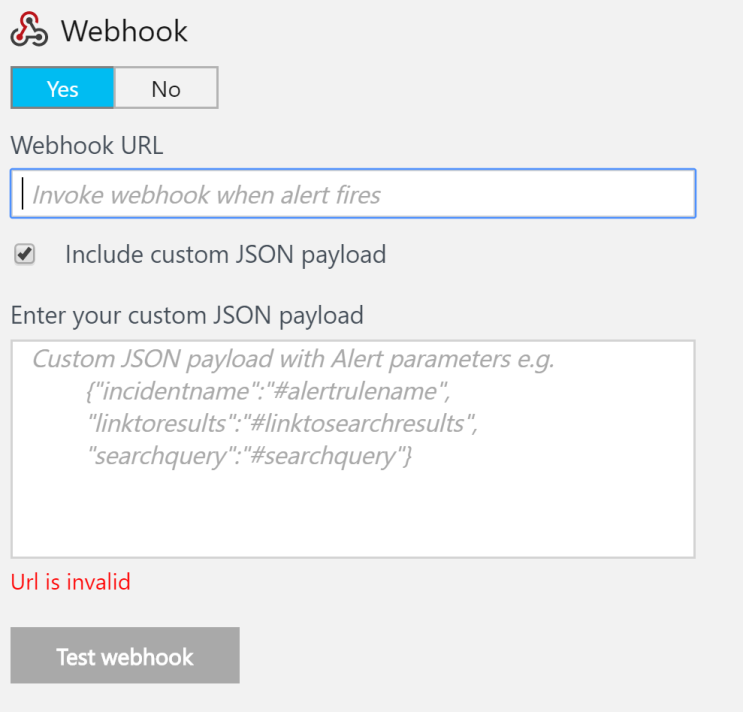
- Webhook: A webhook executes an arbitrary external process using a HTTP POST mechanism. For example, a REST API can be executed, or the Service Manager/ServiceNow APIs can be invoked to create a ticket:
- Runbooks: This action executes Azure Automation runbooks.
- ITSM actions:ITSM solutions should be provisioned before using this option. It helps with connecting and sending information to ITSM systems.
If you found this article interesting, you can explore Azure for Architects to create advanced data and integrated solutions using Azure Event Grid, functions, and containers. Azure for Architects can help you develop a full-fledged Azure cloud solution that is Enterprise class and future-ready.
Share this page on
0
People Like(s) This Page
 Permalink
comments powered by Disqus